The Brief
Prokeep is a customer experience platform for wholesale distributors in HVAC, plumbing, electrical, and auto parts. It started as a messaging tool and grew into a full platform with order automation, broadcast messaging, reporting, and a CRM. As it grew, features piled up wherever there was room.
The challenge: step in as the Senior UX Designer / Architect and give leadership a plan. That meant an audit, a North Star for navigation, a component roadmap, an operating model with Product and Engineering, and a picture of how it would speed up future work.
Prokeep provided fictional but realistic materials: five user quotes, a feature inventory with inconsistency flags, a heatmap summary, and three personas.
The Problem
Growth created structural UX debt
Three patterns stood out in the research.
The inbox ceiling.
Over 90% of clicks happen in the inbox and contact views. Users are comfortable there and lost everywhere else.
"Once I have to leave the inbox to do anything else, I get lost."
High abandonment
Branch managers start reporting flows in Growth Hub and leave before finding what they need.
“The reports page feels like an afterthought.”
The toggle tax
Counter staff click through three or more screens to see a customer’s order history while that customer is waiting.
“I have to click through like three screens to find their order history.”
The Audit
A UX Health Map
I scored the platform’s three product pillars against four questions: Can people find features? Do they know where they are? Does it work for each persona without shadowing someone? Does it fit how they use it on mobile? Each finding cites the research it came from.
The pattern was clear. The inbox was the one healthy part of the product, especially on mobile, where usage spikes at shift changes. Insights & Engagement was critical everywhere, and Connected Technologies had useful features hidden far from the conversation where people needed them.
The North Star
Inbox is the platform. Everything else is centralized within it.
The data already pointed to the answer. People live in the inbox, so instead of pulling them out of it, bring everything else in.
I turned that into three questions for deciding where any feature belongs:
- Does it live in the global nav? Only a short list: Inbox, Growth Hub, Contacts, and Automations. Everything else appears when it’s relevant.
- Does it belong in stacked navigation? Detail views stack on top of the inbox, so people can go deeper and always find their way back.
- Does it belong in the inbox itself? The most critical information, like delivery status, order history, and quick-send broadcast, sits right in the conversation. Zero extra clicks.
What that looks like
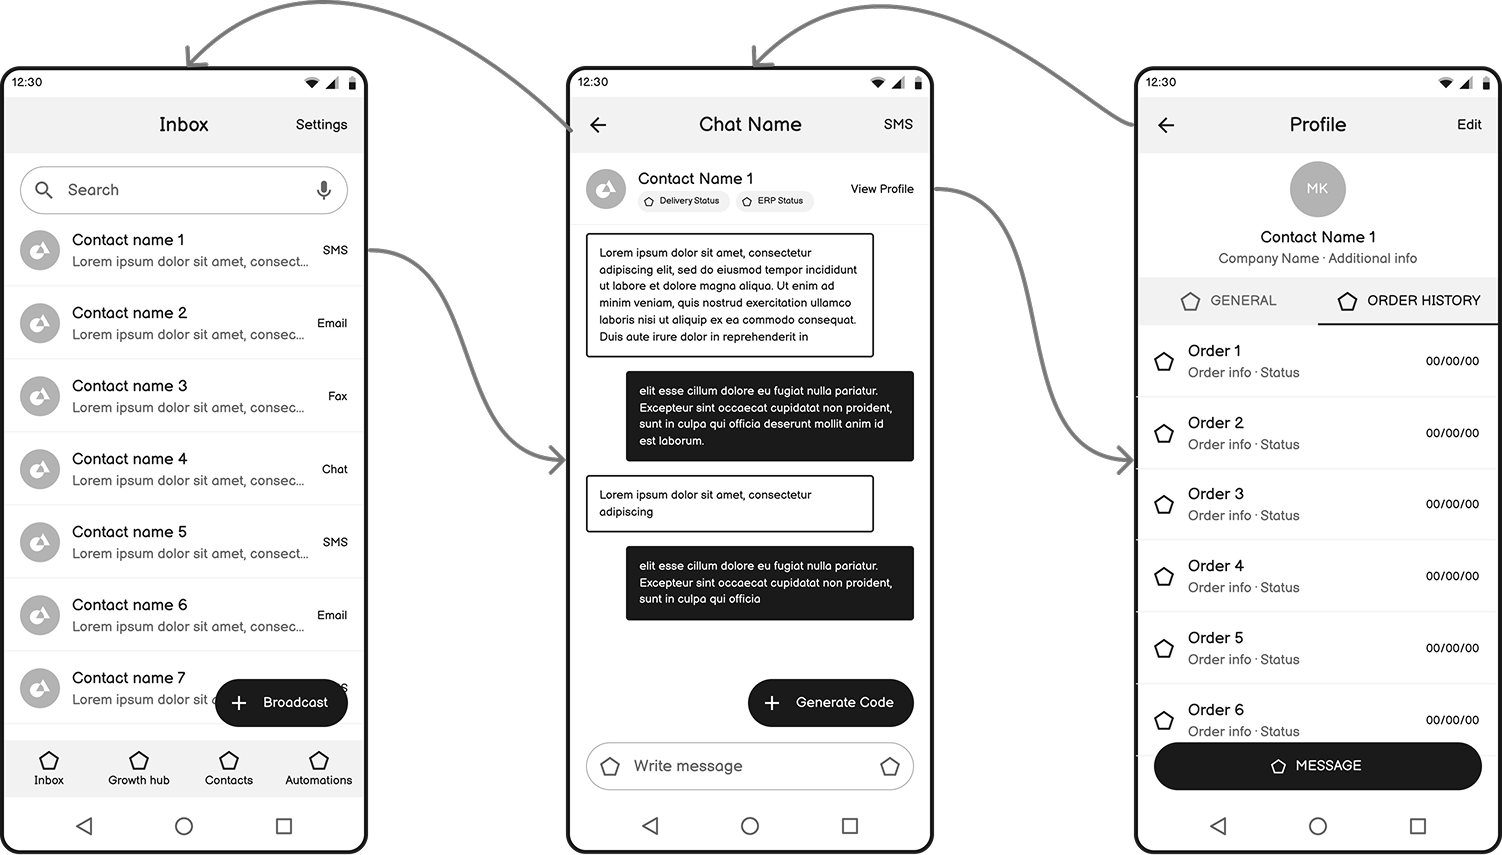
I sketched the counter staff flow on mobile to show the North Star in practice. The inbox gets a four-item nav and a Broadcast button. A conversation shows delivery and ERP status right under the contact’s name, with locker codes one tap away. The contact profile puts order history in its own tab, one step from the conversation instead of three.
Design System Strategy
What to standardize first
The component roadmap started where the impact was biggest.
First, the multi-part components that hold the North Star together: the global navigation shell, a CRM context panel that brings contact and order info into the conversation, and role-based variations for counter staff, branch managers, and sales reps.
Then, the everyday patterns that were inconsistent across modules: data tables and filters, list items, notifications and alerts, empty states, and inline status indicators.
Underneath, a three-layer token system (global, semantic, component), atomic components, and Figma variables named to match the code, so design and engineering work from the same source.
Operating Model
To make the architecture the source of truth, I’d stay in sprint planning to steer net-new versus retrofit decisions, hand off every feature with a design file and a walkthrough, revisit the Health Map with Product and Engineering on a regular cadence, and keep MVPs moving without leaving engineering with design debt.
Expected Impact
- Faster builds. Engineers build a component once and reuse it everywhere.
- Changes at scale. A color, spacing, or rebrand change happens in one place.
- Measurable health. The Health Map gives leadership a running read on the product’s UX, not a one-time audit.
What I Learned
The answer was already in the data. Over 90% of clicks were in the inbox, and every complaint started with leaving it. The strongest architecture decision wasn’t a new structure. It was building around the place users had already chosen.